
SINGAPORE: It was a pattern hidden deep in data, that scientists at the nascent GovTech agency spotted, which helped pinpoint the rogue train that caused a series of disruptions on the Circle Line.
On Thursday (Dec 1), data scientist Daniel Sim gave a detailed account of his team’s work in a blog post on Data.gov.sg, the Singapore government’s open data portal.
While train operator SMRT and the Land Transport Authority (LTA) already knew that the incidents were caused by signal interference, the incidents seemed to occur at random, and investigators had been unable to pinpoint the exact cause.
Initial analysis by GovTech’s scientists too, did not yield any clear answers, said Mr Sim. From data provided by SMRT, the team made the following observations:
1. The incidents were spread throughout the day, and the number of incidents across the day mirrored peak and off-peak travel times;
2. The incidents took place at various locations on the Circle Line, with slightly more occurrences in the west; and
3. The signal interferences did not affect just one or two trains, but many of the trains on the Circle Line.
Initial analysis gave no indication that the train designated as PV46 would eventually be identified as the rogue train. (Image: Data.gov.sg)
The data scientists then sought to incorporate multiple dimensions in their analysis, said Mr Sim. He cited the Marey Chart as their inspiration, noting that it was used by the Boston subway system to visualise the trips made by its trains.
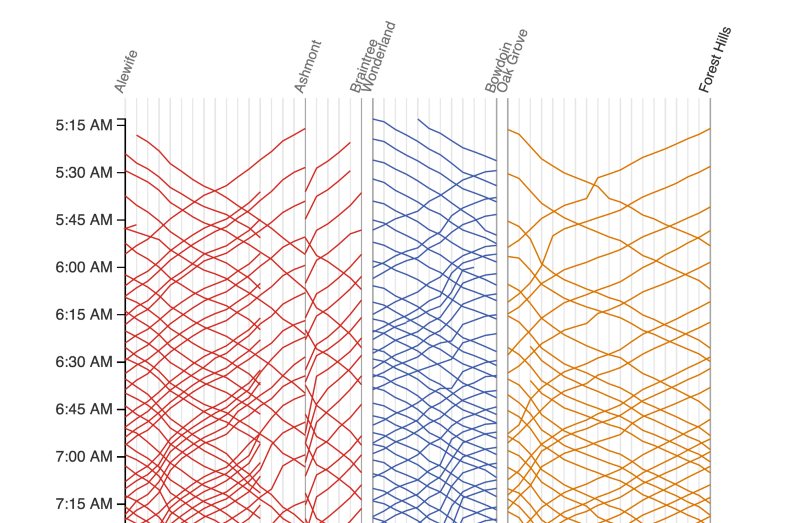
The vertical axis represents time; the horizontal axis represents stations along a train line, and the diagonal lines represent train movement. (Image: Boston’s Massachusetts Bay Transit Authority, via Data.gov.sg)
The data scientists created their own version of the Marey Chart for Singapore’s Circle Line.
Under normal circumstances, said Mr Sim, a train that runs between HarbourFront and Dhoby Ghaut would move in a line similar to this, with each one-way trip taking just over an hour:
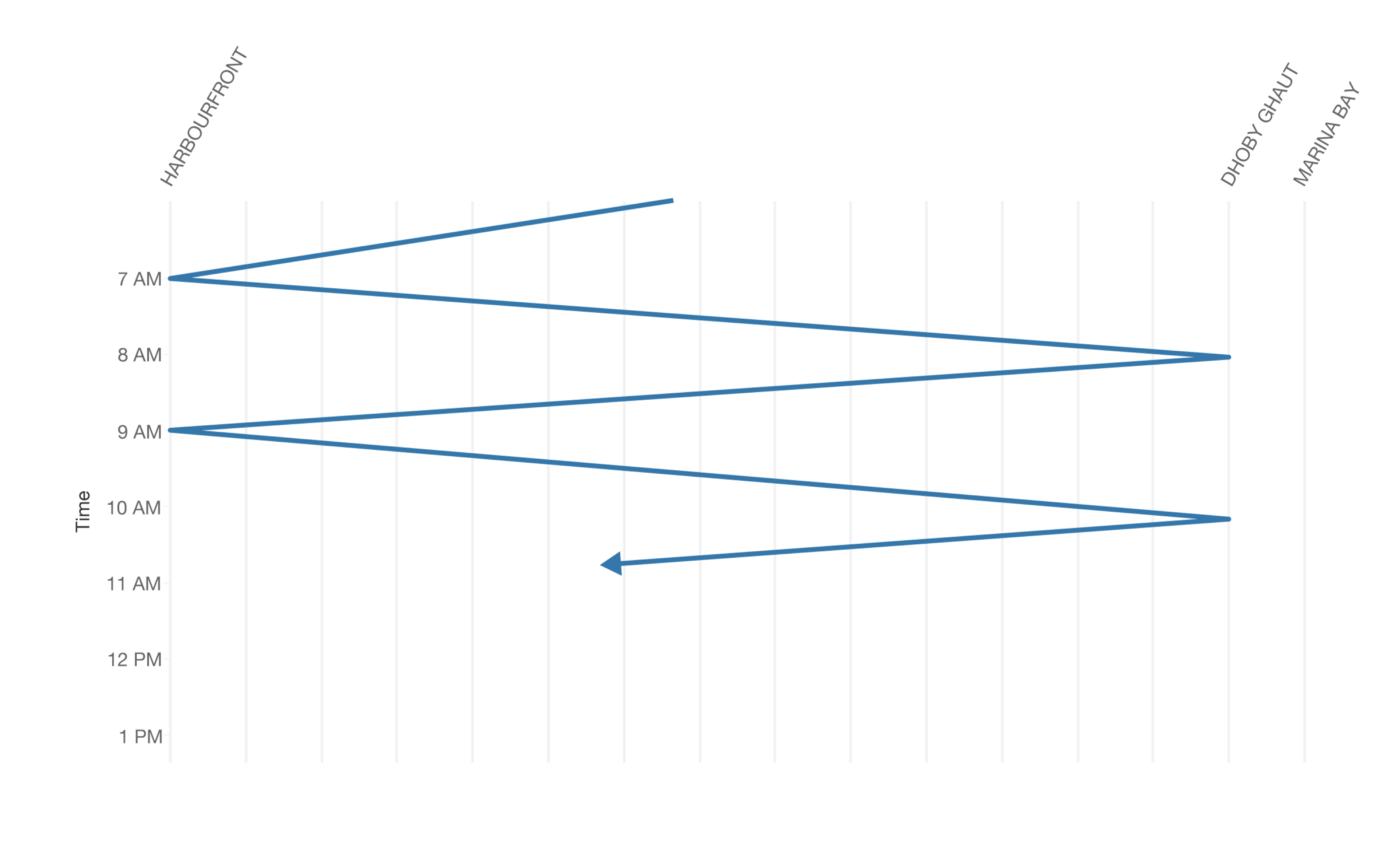
(Image: Data.gov.sg)
The data scientists then plotted the incidents as points on the chart, with each point representing an incident that triggered the train’s emergency brake.
The colours and arrows represent the direction in which each train was travelling at the time of the incident.
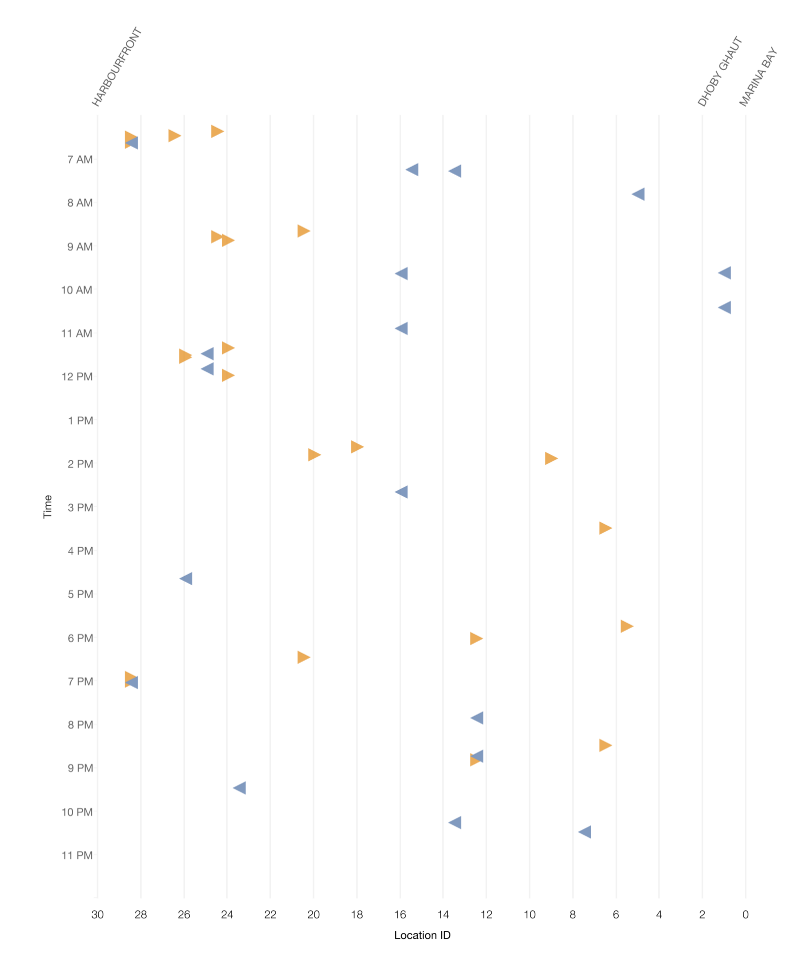
(Image: Data.gov.sg)
“It looked fairly random,” said Mr Sim of the visualisation. “But when we zoomed into the chart, a pattern seemed to surface:”
“If you read the chart carefully, you would notice that the breakdowns seem to happen in sequence. When a train got hit by interference, another train behind moving in the same direction got hit soon after.”
(Image: Data.gov.sg)
It seemed almost like there was a “trail of destruction”, said Mr Sim.
The team questioned if it could be something that was not in their dataset that caused the incidents.
Noting that the imaginary lines connecting the incidents looked “suspiciously similar” to those in a Marey Chart, his team hypothesised that a train on the opposite track could have caused the interference.
In testing their hypothesis, the team grouped emergency braking incidents together if they occurred within four minutes of each other – the upper limit of travel time between Circle Line stations.
They then grouped incidents that could be linked to the same rogue train.
The team concluded that, of the 259 emergency braking incidents in their dataset, 189 cases – or 73 per cent of them – could be explained by the rogue train hypothesis.
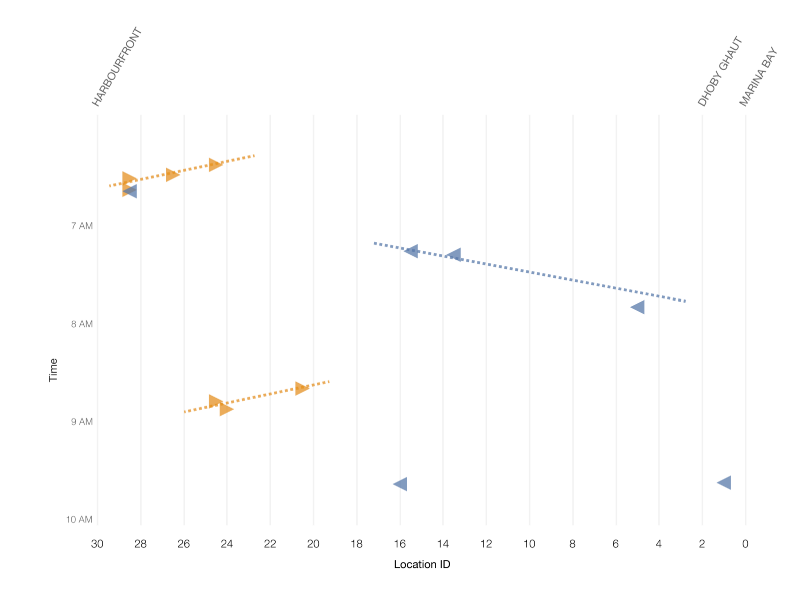
Drawing best-fit lines through the incident plots, the team found that the lines closely matched the movement of a single train. “This strongly implied that there was only one ‘rogue train’,” Mr Sim said.
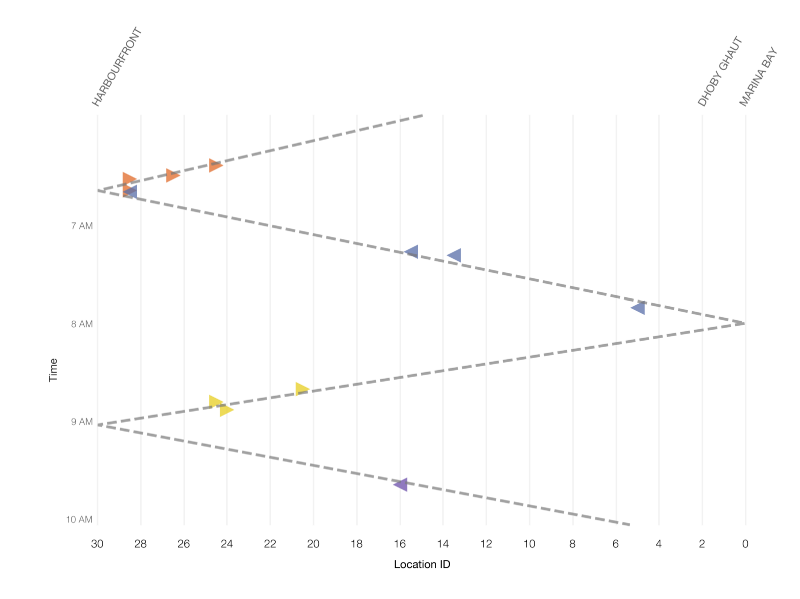
Compare this with the Marey Chart visualisation of a Circle Line train (above). (Image: Data.gov.sg)
The data team then went to Kim Chuan Depot to identify the rogue train. “We could not inspect the detailed train logs that day because SMRT needed more time to extract the data,” said Mr Sim. “So we decided to identify the train the old-school way – by reviewing video records of trains arriving at and leaving each station at the times of the incidents.”
At 3am, the team found its prime suspect: PV46, a train that has been in service since 2015.
On Nov 6, LTA and SMRT tested the hypothesis by running PV46 during off-peak hours and found that it indeed caused nearby trains to lose communications.
Processing the historical location data for PV46, the data team concluded that more than 95% of all incidents from August to November could be explained by its hypothesis.
The pattern was especially clear on certain days, said Mr Sim, pointing out that the incidents happened during or around the time belts when PV46 was in service.
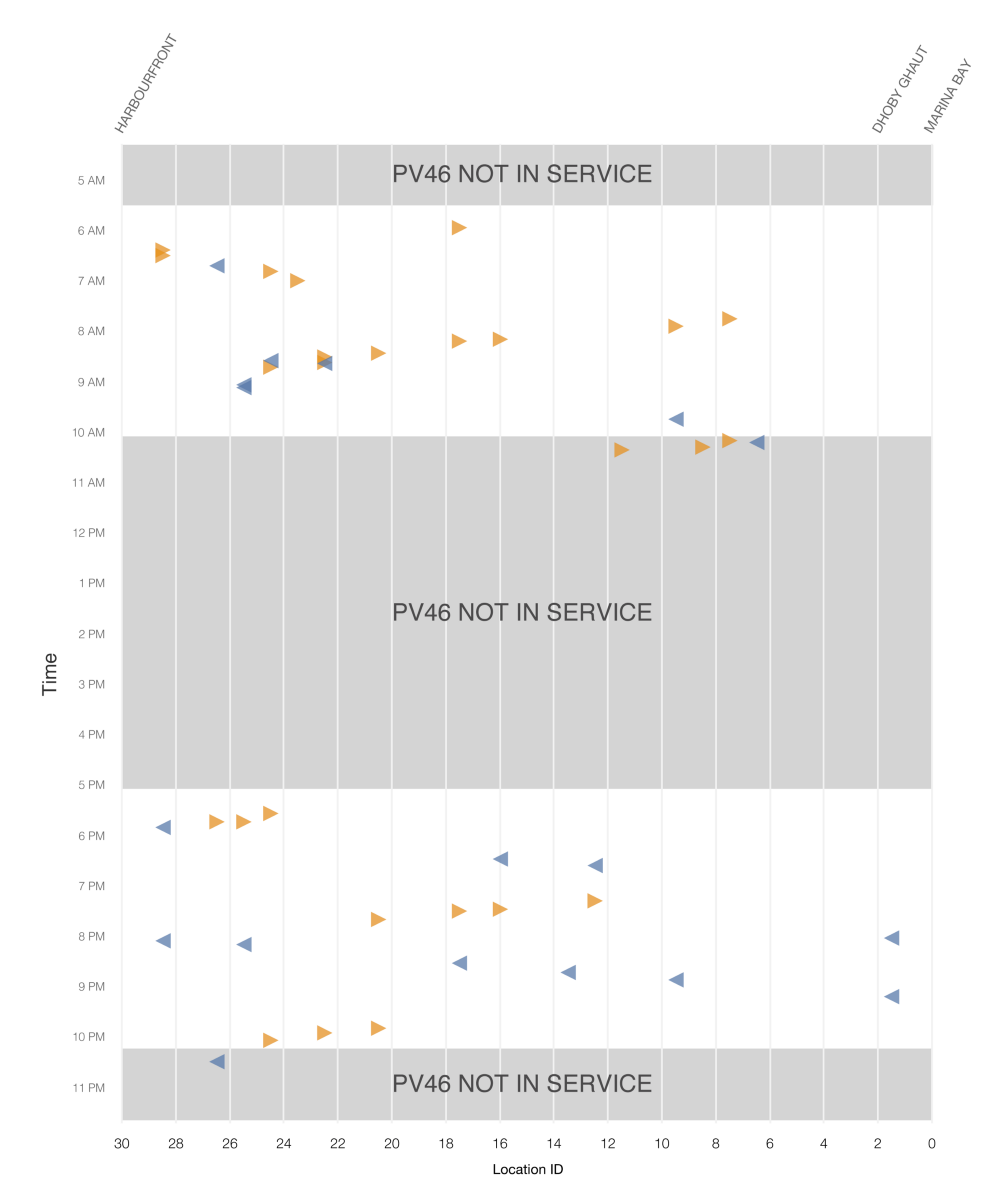
(Image: Data.gov.sg)
Investigations by LTA and the Defence Science and Technology Agency (DSTA) confirmed the hardware problems in PV46 and the train has since been pulled out of service.
Prime Minister Lee Hsien Loong shared the GovTech team’s account of their work on his Facebook page. “It is a fascinating account, demonstrating close teamwork, sharp analysis, and a never-say-die attitude,” he wrote.
“This is how a Smart Nation should use data to solve real-world problems. Proud of the team’s good work, and a big thank you to all the officers who worked so hard to crack the puzzle!”


